
Medical decision making relies heavily on numerical cutoffs to decide whether disease is present or absent. In some ways, this is necessary for us to share a common language, and to help novices understand what values are “abnormal.” It has been suggested that representing data in discrete ways may be necessary for proper discrimination between different states. However, over-reliance on discrete values can create cognitive distortions in clinical practice.
Once again, the statisticians were right
A common theme in conversations amongst statisticians online is frustration with turning continuous variables into categorical ones, often at arbitrary cutoffs, termed “dichotomania” (it even has its own hashtag). Frank Harrell and Stephen Senn, in particular, have written extensively on the topic. Physicians are especially prone to this behavior, especially in research.
Taking information that exists on a continuous scale (such as blood pressure, lactate level, troponin, etc) and transforming it into binary or discrete cutoffs (e.g. “normal/abnormal”, “class 1/2/3”) for statistical and clinical convenience is fraught with issues.
First, there can be a tremendous amount of information lost by categorizing information this way. Consider body mass index (BMI) categories. (I use this example as I have made this specific methodological mistake before). The adjacent categories of class 2 obesity (BMI 35-39.9) and class 3 obesity (BMI ≥ 40) would be regarded similarly in analysis, even though the patents in each bin are markedly different. Patient A, with BMI 70, would be regarded the same as Patient B, with BMI 40.1. However, Patient B is regarded as completely different from patient C, with BMI 39.9, all due to a completely arbitrary cutoff.
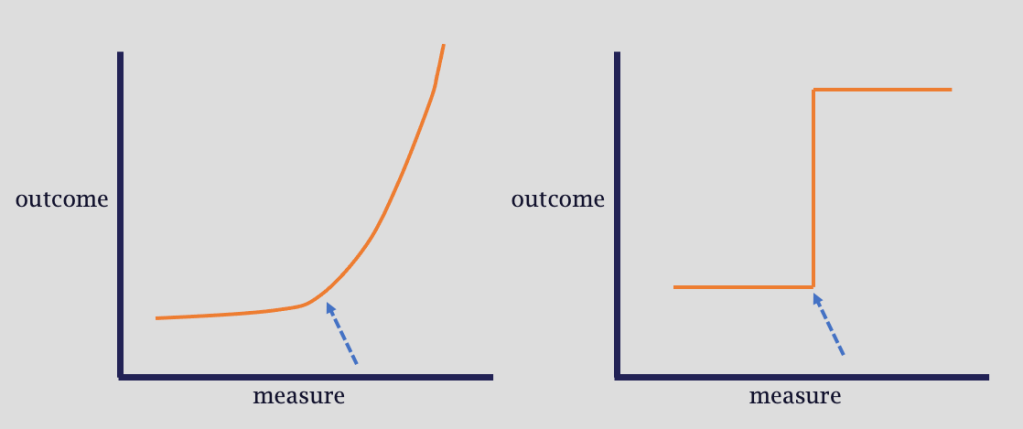
Consider the following diagrams below, adapted from Harrell’s Biostatistics for Biomedical Research, Chapter 18.
Second, and perhaps less relevant to clinical decisions, dichotomized outcomes suffer from significant loss of statistical power. Why disadvantage your own analyses?
Cutting off critical thinking: a tale of four patients
Even without the statistical link, it’s not hard to imagine scenarios in which binary thinking could hinder medical decision making. In fact, it probably happens every day.
Literature from emergency medicine shows how dramatically discrete thinking plays out in decision making. This work* from Stephen Coussens demonstrates how the intensity of work-up for ischemic heart disease differs greatly if you are just above or just below the cutoff of 40 years of age! (The graphs from page 30 onward in the PDF most clearly illustrate this phenomenon).
Another common scenario is the evaluation of the patient with hypotension and/or shock.
Consider the patients on the diagram below, each represented by a shape placed at their mean arterial pressure (MAP). Those with MAPs consistent with “shock” using the traditional cutoff of 65, are in teal; the others are in orange.

- The teal circle patient has a MAP 46, is mottled, encephalopathic, and oliguric
- The teal diamond patient has a MAP 63, is sitting up in bed doing a Sudoku puzzle and just finished breakfast
- The orange open circle patient has MAP 67, you are told “is at baseline”, but actually hasn’t urinated in 10 hours and keeps trying to get out of bed despite re-direction
- Finally, the orange triangle patient is completely asymptomatic and ready to be discharged
By virtue of dichotomania, the teal patients were grouped together, even though they were very different clinically. In fact, the two patients represented by circles are in shock by clinical evaluation even though they are on opposite sides of the cutoff fence.
A casual evaluation of these four patients could easily misclassify those two patients nearest the cutoff.
There are numerous other examples of context-free thinking which we encounter on a daily basis:
| Common Thought Process | Relevant Context |
| The lactate is normal, all is well! | Escalating doses of vasopressors |
| The troponin is elevated, let’s [call cardiology, start heparin, trend it to normal, etc]! | The EKG/echo is unchanged, the troponin is just barely above the lab cutoff, and the patient is not symptomatic of ACS |
| Let’s do an exhaustive work-up of the hyponatremia! | It’s only 2 points under the lower limit of normal, the patient is asymptomatic, etc. |
What’s the answer?
It is neither pragmatic nor possible to eliminate discrete thresholds from medical education or medical decision making. I wouldn’t even advocate for it.
What can we do? Comprehensive, multimodal assessment to make clinical diagnoses, assess risk, and select therapies. Paying attention to the magnitude of detected abnormalities is essential, as it provides far more information than a binary classification.
Above all, we have to model these careful cognitive practices at the bedside for our trainees and teams, ensuring they don’t cut off their own critical thinking.
–MTS
Notes
- *Thanks to Vivek Moitra for the outstanding reference!
- Header image credit: Free-Photos from Pixabay

Continue to monitor Troponin. Onset could have occurred recently and count is just beginning to rise; likewise, onset could have occurred some time ago (48h) and values could have peaked prior to the draw and are already now stabilizing.
LikeLike
all the more reason that context is key!
LikeLike
Great stuff Matt! Good luck on this Venture!! Really excited for this site!
LikeLiked by 1 person
Thanks Eduardo!!
LikeLike
Great stuff Matt! Good luck on this Venture!! Really excited for this site!
LikeLike
Have always wondered if there’s any subtle consequence of differences in units (e.g. in UK vs USA) on decision-making
LikeLiked by 1 person
Wouldn’t be surprised, but I’m sure cutoffs affect decision making no matter the units
LikeLike
This could just as easily be read as a treatise on bayesian thinking
LikeLike
It definitely applies (I say as an avowed Bayesian)
LikeLike